Introduction to the Google Finance Function
In today’s fast-moving markets, investors need reliable tools to track data and make smart decisions and with the abundance of financial data available on the internet, it can be overwhelming to keep track of everything.
Google Sheets, part of the Google Workspace ecosystem, offers a built-in GOOGLEFINANCE() function that pulls market data directly into your spreadsheets, all without needing external API’s or expensive subscription.
Most tutorials stop at the basics, repeating the same examples found in Google’s documentation. In this article we’ll cover what you need to get started. Then, we’ll look at the core capabilities of the GOOGLEFINANCE() function. Future posts will dive into automation, scripting, and using Google Sheets as a lightweight market analysis platform.
What You Need to Get Started
To use Google Sheets and the GOOGLEFINANCE function, you only need:
-
A free Google account
-
A modern web browser (Chrome is preferred, but others like Firefox, Edge, or Safari work)
-
Access to Google Drive
Google Drive & Sheets: Quick Overview
Google Drive gives you 15GB of free cloud storage. It supports folder-based organization, real-time collaboration, and syncing with local devices. It also lets you publish documents directly to the web.
Google Sheets is the spreadsheet tool within Drive. It’s comparable to Excel, LibreOffice Calc, or WPS, but it runs in the cloud. Sheets has matured significantly, now supporting advanced formulas, data visualization, scripting, and add-ons. It even includes built-in support for engineering, statistical, and financial functions like the GOOGLEFINANCE(). A complete overview of these features can be found here.
If you’re coming from Excel, you’ll find that Sheets lacks some power-user features but compensates with live collaboration, Google integrations, and one area where Google-Sheets “excels” is in its help documentation, which is far more accessible and coherent.
What Is Google Finance?
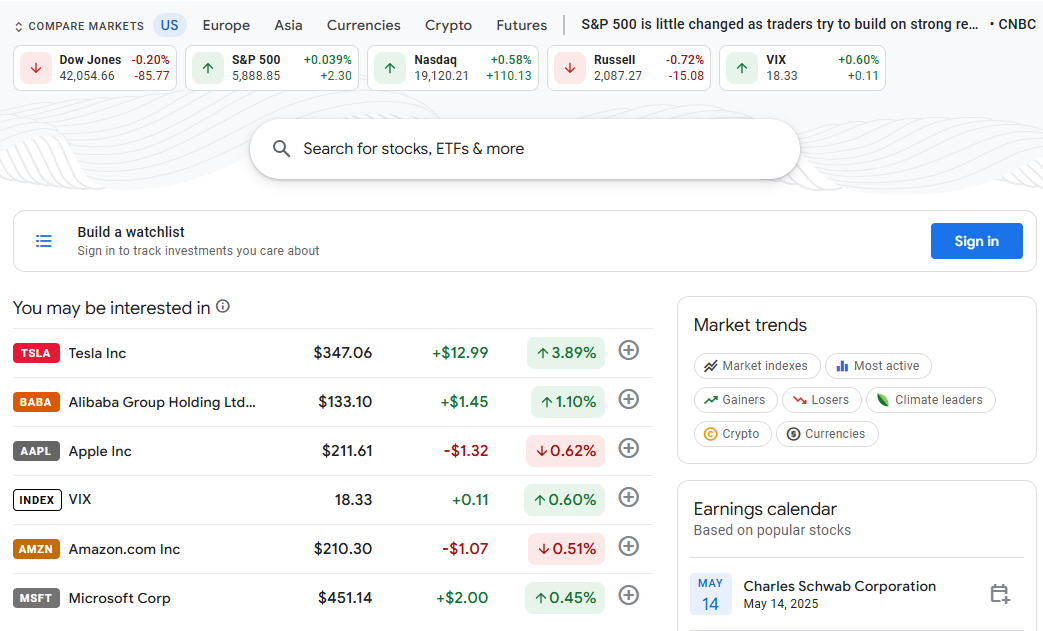
Google Finance is a website that aggregates stock market data, news, and company fundamentals. You can look up stocks, indexes, currencies, and ETFs to view:
-
Live and historical pricing
-
Market cap, volume, and P/E ratios
-
News and headlines
-
Regional market summaries
However, the site itself has limited charting and filtering tools. For more advanced charting, pair Google Finance with something like TradingView, but use Sheets to pull and organize the raw data. Google Finance’s disclaimer mentions that the information provided is intended solely for informational purposes, not trading purposes or advice. Furthermore, the information may be delayed. To find a list of the markets available on Google Finance, you can refer to their Finance Data Listing and Disclaimers page.
Using the GOOGLEFINANCE Function in Sheets
The GOOGLEFINANCE() function allows you to pull live or historical market data directly into a spreadsheet. It takes the form:
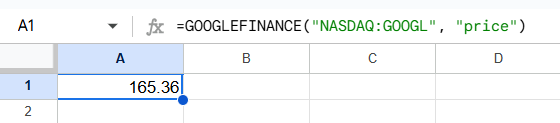
=GOOGLEFINANCE("ticker", "attribute", [start_date], [end_date|num_days], [interval])At minimum, you need a valid ticker symbol and an attribute. Example:
=GOOGLEFINANCE("NASDAQ:GOOGL", "price")This returns the delayed real-time price of Google’s stock on NASDAQ.
Basic Attributes You Can Access
Here are the core attributes available with GOOGLEFINANCE. These work for real-time queries:
|
| Attribute | Description |
|---|---|
"price" | Latest trading price (up to 20-minute delay) |
"priceopen" | Opening price of the current session |
"high" | Daily high price |
"low" | Daily low price |
"volume" | Trading volume for the current day |
"marketcap" | Market capitalization |
"tradetime" | Time of last trade |
"datadelay" | Delay on data |
"volumeavg" | Average daily volume |
"pe" | Price-to-earnings ratio |
"eps" | Earnings per share |
"high52" | 52-week high |
"low52" | 52-week low |
"change" | Price change since previous close |
"changepct" | Percentage change since previous close |
"closeyest" | Yesterday’s closing price |
"shares" | Shares outstanding |
"beta" | Beta value |
"currency" | Trading currency |
Historical Data Attributes
If you’re analyzing trends, historical data is where GOOGLEFINANCE shines. You can specify a date range and interval (daily or weekly). Example:
=GOOGLEFINANCE("NASDAQ:GOOGL", "close", DATE(2024,1,1), TODAY(), "DAILY")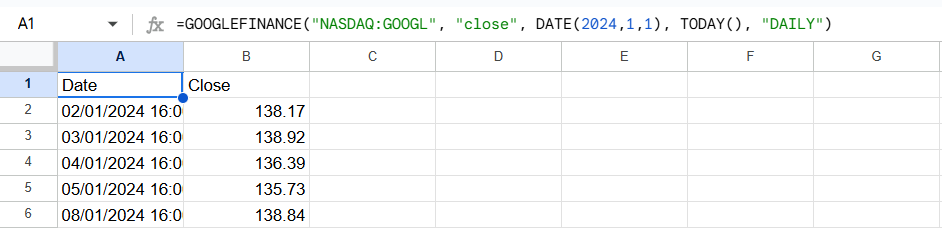
Available attributes for historical data:
| Attribute | Description |
|---|---|
"open" | Opening price for each day |
"close" | Closing price for each day |
"high" | High for each day |
"low" | Low for each day |
"volume" | Daily trading volume |
"all" | Returns all the above |
Next Steps
Now that you’re familiar with the basics, the next article will show you how to:
-
Build automated watchlists using
GOOGLEFINANCE -
Combine technical indicators with formulas
-
Use Apps Script to update and alert you on stock changes
-
Integrate Sheets with external APIs for even more data
-
and much more
Google Sheets is more than a spreadsheet — with the GOOGLEFINANCE function, it’s a powerful tool for data-driven traders.
Happy Trading!