
Last Updated on 10/04/2024 by Ndanileka
About The Relative Strength Index (RSI)

The RSI, introduced by J. Welles Wilder in his 1978 book “New Concepts in Technical Trading Systems,” has remained a timeless and widely used indicator among traders.
Wilder designed the RSI to serve as a momentum oscillator capable of being a universal measure across commodities, smooth erratic price moves, and identify price extremes.
The RSI functions by measuring the average of the gains and losses over a specified period to determine the relative strength of an asset. It ranges between 0 and 100, where values below 30 represent an extreme low and above 70 represent an extreme high.
Some of the key insights that can be derived from the RSI include:
- Tops and Bottoms: The RSI surpassing 70 or dropping below 30 signals potential tops or bottoms, indicating an impending reversal or significant market reaction.
- Chart Formations: The RSI often reveals patterns not immediately evident on a price chart. It can highlight patterns like head and shoulders, pennants, or triangles, offering insights into breakout and buy/sell points.
- Failure Swings: Strong indications of a market reversal occur with failure swings above 70 or below 30.
- Support and Resistance: The RSI can identify support and resistance areas before they become apparent on the price chart.
- Divergence: Divergence between RSI and price action signals a potential market turning point. The divergence occurs when the RSI rises while price movement remains flat or decreases or when the RSI falls while price movement is flat or increasing.
Relative Strength Index Standard Formula

Steps to Obtain the First RSI Value:
- Calculation of Average Gain and Average Loss:
- Calculate the daily price changes (price today – price yesterday).
- Separate the gains (positive changes) and losses (negative changes).
- Calculate the average gain and absolute average loss over a specified period, usually 14 days.


- Calculation of Relative Strength (RS):
- Calculate the Relative Strength (RS) by dividing the Average Gain by the Average Loss.
- Calculation of RSI:
- Calculate the Relative Strength Index (RSI) using the formula:

Once the first average values are calculated, the RSI can be “smoothed” by using the following formulas to obtain the next average values:
Average Gain = [(Past Average Gain) x 13 + Current Gain] ÷ 14
Average Loss = [(Past Average Loss) x 13 + Current Loss] ÷ 14
The degree of smoothing will be based on the period of your data, i.e., how far back the first average values were obtained. However, as our task is to create a single-cell formula in Google Sheets, we will not apply any smoothing after the first value.
Standard Formula Google Sheets (Tutorial)
In the below example, Cell B1 = “ADBE ” (Adobe Inc)
Step 1. Calculate Daily Price Changes from the Previous 14 Days
1.1. Retrieve the Previous 14 Close Prices.
=QUERY(GOOGLEFINANCE(B1,"close",today()-30 ,today()),"SELECT Col2 ORDER by Col1 DESC limit 14")
1.2. Retrieve the Previous 14 Close Prices and Offset by 1.
=QUERY(GOOGLEFINANCE(B1,"close",today()-30 ,today()),"SELECT Col2 ORDER by Col1 DESC limit 14 OFFSET 1")
1.3. Calculate the difference between 1.1 and 1.2 to obtain the price change.
Price Change = Close – Closeyest
=QUERY({QUERY(GOOGLEFINANCE(B1,"close",today()-30 ,today()),"SELECT Col2 ORDER by Col1 DESC LIMIT 14"),QUERY(GOOGLEFINANCE(B1,"close",today()-30 ,today()),"SELECT Col2 ORDER by Col1 DESC LIMIT 14 OFFSET 1 LABEL Col2 'Closeyest'")},"SELECT Col1-Col2")
Step 2. Calculate Average Gain and Average Loss, and Obtain the RS Value
2.1. Calculate the Average Gain.
2.1.1. Filter the Positive Returns from the prices in step 1.3.
=QUERY(QUERY({QUERY(GOOGLEFINANCE(B1,"close",today()-30 ,today()),"SELECT Col2 ORDER by Col1 DESC LIMIT 14"),QUERY(GOOGLEFINANCE(B1,"close",today()-30 ,today()),"SELECT Col2 ORDER by Col1 DESC LIMIT 14 OFFSET 1 LABEL Col2 'Closeyest'")},"SELECT Col1-Col2"),"SELECT Col1 WHERE Col1 > 0 LABEL Col1 ''")
2.1.2. Sum the range from 2.1.1 and divide by the period (14).
=SUM(QUERY(QUERY({QUERY(GOOGLEFINANCE(B1,"close",today()-30 ,today()),"SELECT Col2 ORDER by Col1 DESC LIMIT 14"),QUERY(GOOGLEFINANCE(B1,"close",today()-30 ,today()),"SELECT Col2 ORDER by Col1 DESC LIMIT 14 OFFSET 1 LABEL Col2 'Closeyest'")},"SELECT Col1-Col2"),"SELECT Col1 WHERE Col1 > 0 LABEL Col1 ''"))/14
2.2. Return the Absolute Average Loss.
2.2.1. Filter negative returns from the prices in step 1.3 and wrap them with the absolute function. To make the absolute function work correctly, wrap the whole formula with the array function to ensure the absolute value for each negative value is returned.
=ARRAYFORMULA(ABS(QUERY(QUERY({QUERY(GOOGLEFINANCE(B1,"close",today()-30 ,today()),"SELECT Col2 ORDER by Col1 DESC LIMIT 14"),QUERY(GOOGLEFINANCE(B1,"close",today()-30 ,today()),"SELECT Col2 ORDER by Col1 DESC LIMIT 14 OFFSET 1 LABEL Col2 'Closeyest'")},"SELECT Col1-Col2"),"SELECT Col1 WHERE Col1 < 0 LABEL Col1 ''")))
2.2.2. Sum the range from 2.2.1 and divide by the period (14).
=SUM(ARRAYFORMULA(ABS(QUERY(QUERY({QUERY(GOOGLEFINANCE(B1,"close",today()-30 ,today()),"SELECT Col2 ORDER by Col1 DESC LIMIT 14"),QUERY(GOOGLEFINANCE(B1,"close",today()-30 ,today()),"SELECT Col2 ORDER by Col1 DESC LIMIT 14 OFFSET 1 LABEL Col2 'Closeyest'")},"SELECT Col1-Col2"),"SELECT Col1 WHERE Col1 < 0 LABEL Col1 ''"))))/14
2.3. Calculate the Relative Strength value using the values in steps 2.1.1 and 2.2.2:
RS = (2.1.1/2.2.2)
=(SUM(QUERY(QUERY({QUERY(GOOGLEFINANCE(B1,"close",today()-30 ,today()),"SELECT Col2 ORDER by Col1 DESC LIMIT 14"),QUERY(GOOGLEFINANCE(B1,"close",today()-30 ,today()),"SELECT Col2 ORDER by Col1 DESC LIMIT 14 OFFSET 1 LABEL Col2 'Closeyest'")},"SELECT Col1-Col2"),"SELECT Col1 WHERE Col1 > 0 LABEL Col1 ''"))/14)/(SUM(ARRAYFORMULA(ABS(QUERY(QUERY({QUERY(GOOGLEFINANCE(B1,"close",today()-30 ,today()),"SELECT Col2 ORDER by Col1 DESC LIMIT 14"),QUERY(GOOGLEFINANCE(B1,"close",today()-30 ,today()),"SELECT Col2 ORDER by Col1 DESC LIMIT 14 OFFSET 1 LABEL Col2 'Closeyest'")},"SELECT Col1-Col2"),"SELECT Col1 WHERE Col1 < 0 LABEL Col1 ''"))))/14)
Step 3. Complete the Formula by Calculating the RSI Value.
100 -100/(1 +RS)
=100-(100 / (1+(SUM(QUERY(QUERY({QUERY(GOOGLEFINANCE(B1,"close",today()-30 ,today()),"SELECT Col2 ORDER by Col1 DESC LIMIT 14"),QUERY(GOOGLEFINANCE(B1,"close",today()-30 ,today()),"SELECT Col2 ORDER by Col1 DESC LIMIT 14 OFFSET 1 LABEL Col2 'Closeyest'")},"SELECT Col1-Col2"),"SELECT Col1 WHERE Col1 > 0 LABEL Col1 ''"))/14)/(SUM(ARRAYFORMULA(ABS(QUERY(QUERY({QUERY(GOOGLEFINANCE(B1,"close",today()-30 ,today()),"SELECT Col2 ORDER by Col1 DESC LIMIT 14"),QUERY(GOOGLEFINANCE(B1,"close",today()-30 ,today()),"SELECT Col2 ORDER by Col1 DESC LIMIT 14 OFFSET 1 LABEL Col2 'Closeyest'")},"SELECT Col1-Col2"),"SELECT Col1 WHERE Col1 < 0 LABEL Col1 ''"))))/14)))
Standard Formula Spreadsheet Template
The spreadsheets calculate the RSI Value of stocks listed on the S&P100, with a Price Level column indicating Overbought/Oversold stocks. The data can then be grouped for further analysis.

RSI TradingView Formula
The standard RSI and TradingView RSI are very similar, but with a subtle difference in how they calculate the average gains and losses:
Standard RSI:
Uses a Simple Moving Average (SMA) to calculate the average gain and loss over a specific period (typically 14 days). This means it simply adds up the recent gains/losses and divides by the number of periods (14 in this case). Your formula (100 – (100 / (1 + RS))) is then used to calculate the RSI based on these averages.
TradingView RSI:
Uses a Relative Moving Average (RMA) to calculate the average gain and loss. An RMA is essentially an Exponential Moving Average (EMA) with a weight of 1/period. This gives more weight to recent price changes compared to the standard SMA. TradingView then applies the same formula (100 – (100 / (1 + RS))) to calculate the RSI for all values using the RMA.
In simpler terms, standard RSI averages recent gains/losses with equal weight for each period.
Trading View RSI averages recent gains/losses with more weight given to the most recent price changes. The difference is usually slight, but the Trading View RSI might be more reactive to recent price movements due to the RMA. This can be helpful in volatile markets where recent price action is more important. Ultimately, both versions identify overbought and oversold levels similarly, with the standard settings being 70 for overbought and 30 for oversold.
Calculation Steps
Step 1. Calculate Price Change:
First, calculate the price change for each period by subtracting the previous closing price from the current closing price. Then return the results in a series of positive and negative price changes.

Step 2. Separate Positive and Negative Returns:
Separate the positive returns (gains) and absolute negative returns (losses) into two separate arrays.
If a return is positive, add a zero on the negative corresponding column and vice versa, this ensures that the series count equals the period of the RSI.
Gains contain zeros and positive price changes, while losses contain zero’s and the absolute value of all negative price changes.

Step 3. Calculate Relative Moving Averages (RMA):
- Next, calculate the Relative Moving Averages (RMA) for both gains and losses separately. Use an Exponential Moving Average (EMA) formula with a weight of 1/period to calculate the RMA.
- For the initial period (typically the first 14 days), use a Simple Moving Average (SMA) to calculate the baseline RMA values.

Step 4. Calculate Relative Strength (RS):
- Calculate the Relative Strength (RS) for each corresponding gain and loss. Divide the RMA of gains by the RMA of losses to obtain the RS value for each period.

Step 5. Calculate Relative Strength Index (RSI):
- Finally, calculate the Relative Strength Index (RSI) for each RS value using the standard RSI formula: RSI = 100 – (100 / (1 + RS)).

Function Parameters
The function consists of two parameters:
- Range: The “range” parameter represents the date and close price data required for the calculation.
- Period: The “period” parameter specifies the period of the RSI, such as 14 for a 14-day RSI

Apps Script Code
/**
 * Calculates the Relative Strength Index (RSI) based on the provided price data range.
 * Range example ,QUERY(QUERY(GOOGLEFINANCE(B1,"close",TODAY()-200,TODAY()), "SELECT *", 1),"SELECT* OFFSET 1",0)
 * @param {array} range A range containing  date and close price price data from Google Finance.
 * range example
 * @param {number} period The period for calculating the RSI.
 * @return {array} The RSI values along with corresponding dates.
 * @customfunction
 */
function RSI_GOOGLEFINANCE(range, period) {
  // Check if the period is greater than the length of the range
  if (period > range.length) {
    throw "Error: The specified period exceeds the length of the range.";
  }

  const dates = range.map(row => new Date(row[0])); // Convert date strings to Date objects
  const closePrices = range.map(row => parseFloat(row[1])); // Parse close prices as floats

  // Initialize arrays to store gains and losses
  let gains = [];
  let losses = [];

  // Calculate price changes
  for (let i = 1; i < closePrices.length; i++) {
    let priceChange = closePrices[i] - closePrices[i - 1];
    if (priceChange > 0) {
      gains.push(priceChange);
      losses.push(0); // Placeholder for losses
    } else {
      gains.push(0); // Placeholder for gains
      losses.push(Math.abs(priceChange));
    }
  }


  // Calculate average gain and average loss over the specified period
  let avgGains = RMA(gains, period);
  let avgLosses = RMA(losses, period);

  //Calculate the RSIs values and add corresponding date
 let RSIs = avgGains.map((avgGain, index) => {
    let RS = avgGain / avgLosses[index];
    return [dates[index + period], 100 - (100 / (1 + RS))];
  });

  // Prepare the final RSI data structure
  const rsiData = [['Date','RSI'],...RSIs]

  return rsiData;
}

/**
 * Calculates the Relative Moving Average  based on the provided price change .
 *
 * @param {array} numbers Array of price changes.
 * @param {number} period The period for calculating the RSI.
 * @return {array} The RMA values.
 */

function RMA(range, n) {
  if (n > range.length) {
    throw "Error: The specified period exceeds the length of the range.";
  }

  const priceChange = range.map(parseFloat); // priceChange as floats

  // Initialize an array to store RMA values
  let rma = [];

  // Calculate the multiplier for RMA calculation
  const multiplier = 1 / n;

  // Calculate SMA for the first n data points
  let sum = 0;
  for (let i = 0; i < n; i++) {
    sum += priceChange[i];
  }
  let sma = sum / n;

  // The first RMA
  rma.push(sma);

  // Calculate RMA for the remaining data points
  for (let i = n; i < priceChange.length; i++) {
    const currentChange = priceChange[i];
    const prevRMA = rma[rma.length - 1];
    const currentRMA = (currentChange - prevRMA) * multiplier + prevRMA;

    // Append the current RMA to the rma array
    rma.push(currentRMA);
  }

  return rma;
}
How to use
- In Google Sheets open the “Extensions” menu and select “Apps Scripts”.
- Paste the RSI_GOOGLEFINANCE code into the script editor and save it as “rsiGoogleFinance.gs”.
- Go back to your Google Sheets document.
- Enter “=RSI_GOOGLEFINANCE()” in a cell to use the function.
Spreadsheet Template


Happy Trading!


RSI calculation using google sheet provided differs from 14 day RSI values on charts in a large way. eg.
NSE:HDFCBANK RSI value as per your sheet template comes to 61.68 whereas actual 14 day RSI is 45.81. Difference is huge.
Another example is NSE:DIVISLAB, RSI as per your sheet comes to 12.5 whereas actual 14 day RSI on various charting platform is 33.50
The difference in RSI value arises due to “smoothing”, which most platforms apply after the first RSI value. The smoothing period may vary depending on the platform used, which means there is no fixed RSI value.
The aim of the Google Sheet formula is to create a single cell RSI value; hence, no smoothing is applied. This results in an erratic RSI value as it only considers the previous 14 days of price data.
To resolve this issue, you can load close price data on a sheet and manually calculate smoothing by using additional cells and formulas.
Average Gain = [(Past Average Gain) x 13 + Current Gain] ÷ 14
Average Loss = [(Past Average Loss) x 13 + Current Loss] ÷ 14
You can find an example of this solution here: https://school.stockcharts.com/doku.php?id=technical_indicators:relative_strength_index_rsi.
First of all let me Thank You for the single cell formula. I was trying for it since last many months without any success. And thank you for the reply. Is there a way to incorporate smoothening calculation in single cell formula ?
Creating a single cell formula for a smoothed RSI is beyond my current GoogleSheets skills.
It would be better if Google allowed the Googlefinance() function to be used in App Scripts.
Historical GOOGLEFINANCE data no longer accessible outside of Google Sheets
However, if you are willing to manage your watchlist as a database,
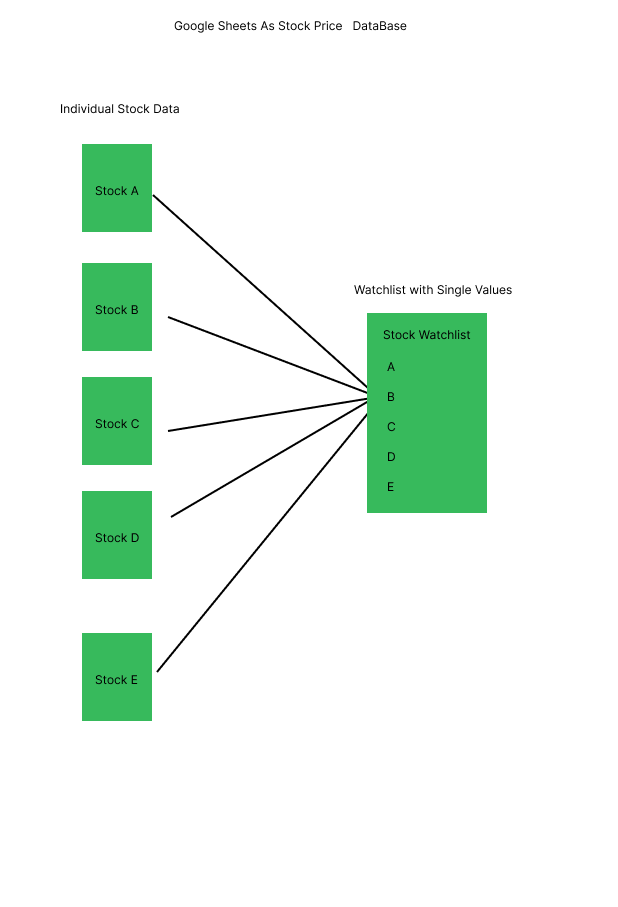
You can create individuals sheets for each stocks and then link the calculated values
to a master sheet.
Thank you. Regards
Hey, thanks for the encouragement. I spent some time figuring out how to implement Apps Script. I’ve updated the blog with a custom function you can try
tw_rsi