Introducing Technical Analysis Functions for Google Sheets™
The Technical Analysis Functions add-on simplifies trading analysis by integrating a library of indicators directly into Google Sheets™ formula system.
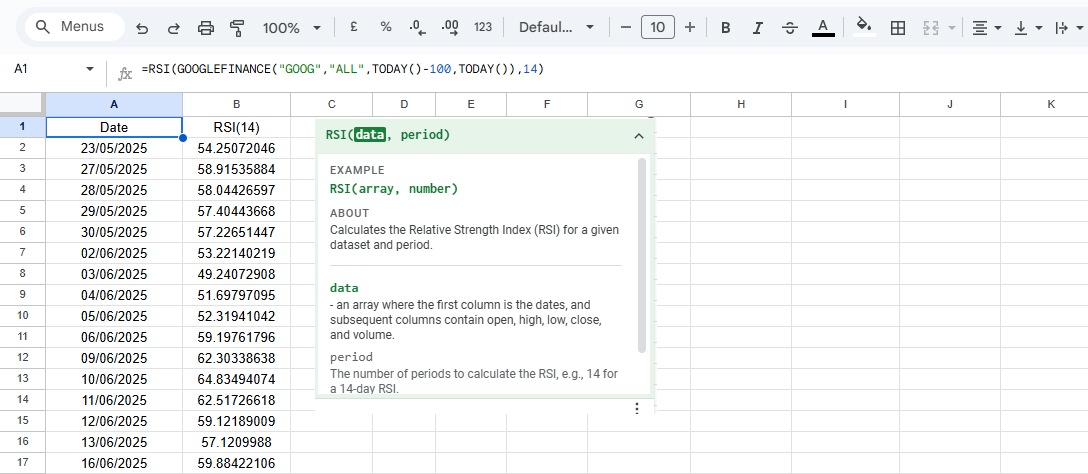
Instead of building fragile, multi-step nested formulas, this tool consolidates technical indicators into a comprehensive set of functions. You can calculate an indicator by typing a formula like =RSI(data, period) directly into a cell.
Getting Started
The Technical Analysis Functions add-on provides a comprehensive library of technical indicators directly inside your spreadsheets.
Key Features
Native Formula Syntax
Use functions like =ATR() with the same simple syntax as any built-in Sheets function.
Automatic Array Output
A single formula returns a full historical array, instantly populating your columns.
Flexible Data Input
Works with any data source that provides an DOHLCV format, giving you full control.
Live Data Compatibility
Analyze markets in real-time by integrating with live data from =GOOGLEFINANCE().
Next Steps
Explore our complete documentation for every indicator, featuring input formats, examples, and return behaviors.